IS 112 Students - Here's the list of the reference web address for your Photoshop CS2
1. http://www.garysimon.net/logotutorial/
2. http://ijaar.com/30-awesome-logo-design-tutorials-for-beginners/
3. http://www.ehow.com/how_4804516_design-awesome-logo.html
4. http://www.techtreak.com/web-design-tips/25-best-logo-design-tutorials-using-photoshop/
5. http://pelfusion.com/tutorials/35-logo-designing-photoshop-tutorials/
Friday, December 3, 2010
Sunday, November 7, 2010
Saturday, October 16, 2010
Simulations
Monte Carlo Simulations - http://www.chem.unl.edu/zeng/joy/mclab/mcintro.html
Sample Programs - http://omlc.ogi.edu/software/mc/
Summary: This document introduces the concept of Monte Carlo methods by defining the terms and describing a simple example (the determination of pi using a Monte Carlo simulation). Following this introduction is a section on the Monte Carlo experiment, part of the physical chemistry lab at UNL, which computes the population distribution in the rotational energy levels of HCl and DCl.
The use of MC methods to model physical problems allows us to examine more complex systems than we otherwise can. Solving equations which describe the interactions between two atoms is fairly simple; solving the same equations for hundreds or thousands of atoms is impossible. With MC methods, a large system can be sampled in a number of random configurations, and that data can be used to describe the system as a whole.
"Hit and miss" integration is the simplest type of MC method to understand, and it is the type of experiment used in this lab to determine the HCl/DCl energy level population distribution. Before discussing the lab, however, we will begin with a simple geometric MC experiment which calculates the value of pi based on a "hit and miss" integration.
 The first figure is simply a unit circle circumscribed by a square. We could examine this problem in terms of the full circle and square, but it's easier to examine just one quadrant of the circle, as in the figure below.
If you are a very poor dart player, it is easy to imagine throwing darts randomly at Figure 2, and it should be apparent that of the total number of darts that hit within the square, the number of darts that hit the shaded part (circle quadrant) is proportional to the area of that part. In other words,
If you remember your geometry, it's easy to show that
If each dart thrown lands somewhere inside the square, the ratio of "hits" (in the shaded area) to "throws" will be one-fourth the value of pi. If you actually do this experiment, you'll soon realize that it takes a very large number of throws to get a decent value of pi...well over 1,000. To make things easy on ourselves, we can have computers generate random* numbers.
If we say our circle's radius is 1.0, for each throw we can generate two random numbers, an x and a y coordinate, which we can then use to calculate the distance from the origin (0,0) using the Pythagorean theorem. If the distance from the origin is less than or equal to 1.0, it is within the shaded area and counts as a hit. Do this thousands (or millions) of times, and you will wind up with an estimate of the value of pi. How good it is depends on how many iterations (throws) are done, and to a lesser extent on the quality of the random number generator. Simple computer code for a single iteration, or throw, might be:
For this lab, the Boltzmann distribution can be solved analytically, and it is in fact used in determining the Monte Carlo distribution. As such, this is not a particularly informative simulation (you could just solve the Boltzmann equation for however many energy levels you wished and look at those numbers). However, this lab allows you to watch how changing the number of throws affects the results, and it automates the examination of the effects of temperature and isotope on population of energy levels.
The process used by the computer program for this lab is quite simple.
* Computer-generated numbers aren't really random, since computers are deterministic. But, given a number to start with--generally called a random number seed--a number of mathematical operations can be performed on the seed so as to generate unrelated (pseudorandom) numbers. The output of random number generators is tested with rigorous statistical tests to ensure that the numbers are random in relation to one another. One caveat: If you use a random number seed more than once, you will get identical random numbers every time. Thus, for multiple trials, different random number seeds must be used. Commercial programs, like Mathematica, pull a random number seed from somewhere within the system--perhaps the time on the clock--so the seed is unlikely to be the same for two different experiments.
Sample Programs - http://omlc.ogi.edu/software/mc/
Summary: This document introduces the concept of Monte Carlo methods by defining the terms and describing a simple example (the determination of pi using a Monte Carlo simulation). Following this introduction is a section on the Monte Carlo experiment, part of the physical chemistry lab at UNL, which computes the population distribution in the rotational energy levels of HCl and DCl.
Introduction to Monte Carlo Methods
The expression "Monte Carlo method" is actually very general. Monte Carlo (MC) methods are stochastic techniques--meaning they are based on the use of random numbers and probability statistics to investigate problems. You can find MC methods used in everything from economics to nuclear physics to regulating the flow of traffic. Of course the way they are applied varies widely from field to field, and there are dozens of subsets of MC even within chemistry. But, strictly speaking, to call something a "Monte Carlo" experiment, all you need to do is use random numbers to examine some problem.The use of MC methods to model physical problems allows us to examine more complex systems than we otherwise can. Solving equations which describe the interactions between two atoms is fairly simple; solving the same equations for hundreds or thousands of atoms is impossible. With MC methods, a large system can be sampled in a number of random configurations, and that data can be used to describe the system as a whole.
"Hit and miss" integration is the simplest type of MC method to understand, and it is the type of experiment used in this lab to determine the HCl/DCl energy level population distribution. Before discussing the lab, however, we will begin with a simple geometric MC experiment which calculates the value of pi based on a "hit and miss" integration.
Monte Carlo Calculation of Pi
The first figure is simply a unit circle circumscribed by a square. We could examine this problem in terms of the full circle and square, but it's easier to examine just one quadrant of the circle, as in the figure below. If you are a very poor dart player, it is easy to imagine throwing darts randomly at Figure 2, and it should be apparent that of the total number of darts that hit within the square, the number of darts that hit the shaded part (circle quadrant) is proportional to the area of that part. In other words,
If you remember your geometry, it's easy to show that
If each dart thrown lands somewhere inside the square, the ratio of "hits" (in the shaded area) to "throws" will be one-fourth the value of pi. If you actually do this experiment, you'll soon realize that it takes a very large number of throws to get a decent value of pi...well over 1,000. To make things easy on ourselves, we can have computers generate random* numbers.
If we say our circle's radius is 1.0, for each throw we can generate two random numbers, an x and a y coordinate, which we can then use to calculate the distance from the origin (0,0) using the Pythagorean theorem. If the distance from the origin is less than or equal to 1.0, it is within the shaded area and counts as a hit. Do this thousands (or millions) of times, and you will wind up with an estimate of the value of pi. How good it is depends on how many iterations (throws) are done, and to a lesser extent on the quality of the random number generator. Simple computer code for a single iteration, or throw, might be:
x=(random#)
 y=(random#)
 dist=sqrt(x^2 + y^2)
 if dist.from.origin (less.than.or.equal.to) 1.0
  let hits=hits+1.0
Monte Carlo Computation of Population Distribution
The actual Monte Carlo method used in this lab to determine the population distribution among rotational energy levels is simpler than the two-dimensional example of the estimation of pi, as only one random number is generated for each "throw." This will be apparent shortly.For this lab, the Boltzmann distribution can be solved analytically, and it is in fact used in determining the Monte Carlo distribution. As such, this is not a particularly informative simulation (you could just solve the Boltzmann equation for however many energy levels you wished and look at those numbers). However, this lab allows you to watch how changing the number of throws affects the results, and it automates the examination of the effects of temperature and isotope on population of energy levels.
The process used by the computer program for this lab is quite simple.
- The input information is used to solve the Boltzmann equation for some number of energy levels. For a maximum of J=4, the relative populations might look like the figure to the right.
- The rest of the simulation is easier to understand if you imagine laying the peaks in the "spectrum" side-by-side, as shown below. If we generate random numbers along that line, whenever a number falls within the range of a particular J value, it counts as a "hit" for that energy level. Obviously, for shorter lengths (J=0) the number of "hits" will be smaller than for longer lengths (J=2).

- Since random number generators typically produce numbers on the range of zero to one, the population distribution is normalized so that the total "length" is equal to 1.0.
- For each "throw," or random number produced, the computer determines which energy level range it belongs to, and calls it a "hit" for that J value. After the computer completes all throws, the number of hits (or relative number of hits) for each energy level are given. It is up to you to compare this output to the theoretical distribution produced by the Boltzmann equation, as described in the Lab Report Instructions.

* Computer-generated numbers aren't really random, since computers are deterministic. But, given a number to start with--generally called a random number seed--a number of mathematical operations can be performed on the seed so as to generate unrelated (pseudorandom) numbers. The output of random number generators is tested with rigorous statistical tests to ensure that the numbers are random in relation to one another. One caveat: If you use a random number seed more than once, you will get identical random numbers every time. Thus, for multiple trials, different random number seeds must be used. Commercial programs, like Mathematica, pull a random number seed from somewhere within the system--perhaps the time on the clock--so the seed is unlikely to be the same for two different experiments.
Monday, October 11, 2010
Examination Day
Examination Day - October 13-16
Wednesday 10:30 - 303; 4:30 - 306
Thursday 1:30 - 304; 4:30 - RSB3
Friday 7:30 - 301; 10:30 - 207
Wednesday 10:30 - 303; 4:30 - 306
Thursday 1:30 - 304; 4:30 - RSB3
Friday 7:30 - 301; 10:30 - 207
Wednesday, October 6, 2010
Wednesday, September 15, 2010
Photoshop CS2 Animation
http://www.ehow.com/how_4447746_animation-photoshop-cs.html
How to Make Animation in PhotoShop CS2
Tuesday, September 14, 2010
Projects/Ecommerce Integration/FunctionalSpecifications
Projects/Ecommerce Integration/FunctionalSpecifications
http://wiki.openbravo.com/wiki/Projects/Ecommerce_Integration/FunctionalSpecifications
Purpose
The purpose of this project is to enable companies to extend their business processes allowing customers to do real-time transactions through an on-line shopping front-end and use Openbravo ERP as a back-end.Scope
The scope of this project is restricted to extend the current Openbravo web services to integrate Openbravo ERP with ecommerce's solutions and develop a connector for the Magento e-commerce platform as an example of this integration.User roles & profiles
- The system administrator. The person that installs Openbravo ERP, the e-commerce platform and the Openbravo ERP / e-commerce connector. Additionally, this person also setups Openbravo ERP and the e-commerce systems for their operation.
- The customer. The person that connects to the on-line e-commerce front-end and browses the product catalog or places an order.
- The sales manager. The person is the company that looks after the sales orders and ensures that all the sales operations work correctly.
Business process definition
- Search the product catalog.
- Browse the product catalog.
- Making an order using an on-line front-end.
- Notifying the customer that is not enough stock.
- Generate an invoice for an order that has been completed.
User stories
Story 1. A customer connects to the e-commerce front-end looking for a product:- The customer starts at the e-commerce front-end main page.
- The customer searches in the products catalog for a specific product.
- The customer gets information about the product.
- The customer decides if she wants to proceed with an order.
- The customer starts at the e-commerce front-end main page.
- The customer browser hierarchically the products catalog.
- The customer gets information about the product.
- The customer decides if she wants to proceed with an order.
- The customer registers or logins into the system.
- The customer places an order within the system.
- System checks that there is enough stock.
- Completes the order successfully.
- Decides if she wants an invoice send by mail or shown to her.
- The customer registers or logins into the system.
- The customer places an order within the system.
- System checks that there is enough stock.
- The user is informed of the shortage of stock.
- The customer logins into the system.
- Browses her historical list of sales orders.
- Selects the order for which wants more detail and its status.
- Detail of the order is shown.
Functional requirements based on business processes
Customer managementIt's a common scenario that a new user registers using the e-commerce front-end to be able to perform a commercial transaction later. It should be possible to:
- Check if a customer already exists in Openbravo ERP.
- Create new customers in Openbravo ERP.
- Modify the information of a customer in Openbravo ERP.
A product catalog contains all the products that a user can view.
General considerations:
- Openbravo ERP supports multiple languages for the product name.
- All the information about the products in the catalog is stored in Openbravo ERP.
- Browse the product catalog hierarchically sorted by alphabetically by product name.
- Browse the product catalog hierarchically by product category.
- Search the product catalog.
- Get all the details of a product.
- Product name.
- Product description.
- Product category.
- Product attributes (weight, color, size, etc).
- Product price and tax.
Sales order
It should be possible for a user to:
- Perform a full sales order.
- Modify or cancel an order once it has been created in the system.
- Get a list of the products that has bought.
- Track the status of his orders pending to be send.
It should be possible for the e-commerce system:
- Get access to the full invoice object to render an invoice by itself.
- Get a PDF version of an invoice using the default server report.
User Interface Mockups
Technical Requirements
Web services allows applications to be integrated more rapidly and easily. Integration focuses on the XML messages that define the services rather than the protocol used to relay these messages. These characteristics are ideal for connecting business functions across heterogeneous systems.The integration requirements are:
- The e-commerce system makes calls to the Openbravo ERP web service whenever it requires a synchronization.
- The definition of these web services should not change from version to version to guarantee the integration with different Openbravo ERP versions.
Non-Functional Requirements
These are general requirements that impact in the technical decisions:- The final system should scale correctly to support high traffic loads.
- Security is key since we are performing commercial translations and dealing with confidential data.
- It is important that all process within Openbravo ERP are automatic (e.g.: see blocking issue 4322)
Open Discussion Items
- Which e-commerce platform is better to do the example integration?
Saturday, September 4, 2010
Teaching Strategies
Seminar Workshop in Teaching Strategies and Preparation of Materials
September 03, 2010
Learning Styles: I am:
1. Pragmatic - like to try new ideas
2. Reflectors - observe and think
3. Theorists - sysmatic
4. Activist - result oriented
-----------------------------------------------------
Tell me and i'll forget
Show me and i may remember
Involve me and i'll understand
-----------------------------------------------------
He who knows not and knows not he knows not, he is a FOOL, shun him
He who knows not and knows, he knows not he is SIMPLE... teach him
He who knows and knows not he knows he is ASLEEP... wake him
He who knows and knows he knows, he is WISE... follow him
----------------------------------------------------
Monday, August 16, 2010
Monday, July 26, 2010
To find the greatest common factor?
How do you write a program in Java to find the greatest common factor?
import java.util.Scanner;
public class Gcd
{
public static void main(String args[])
{
int temp=0,i;
Scanner s=new Scanner(System.in);
System.out.println("enter 2 numbers");
int a=s.nextInt();
int b=s.nextInt();
for(i=2;i<=a;i++)
{
if(a%i==0)
{
if(b%i==0)
temp=i;
}//end of if
}//end of for
System.out.println("Gcd is:");
System.out.println(temp);
}//end of main
}//end of class
Java
What is a Java program that finds the greatest common factor of two integers?
If you're interested only in solving the problem, and not in performance, then the simplest way is to simply start by trying to divide one number by the other. If they divide evenly, then that number is the GCF, else subtract it by one and keep trying.
public static int GCF(int a, int b) {
// current will start off as the lesser of the two numbers.
// after each attempt to find a common factor, decrement current
int current = Math.min(a,b);
// loop until current is 1. if this happens, all other possibilities have been
// eliminated and thus a and b share no common factors other than 1
while( current > 1) {
// check factors
if( (a%current) == 0 ) {// check if current is a factor of a
if( (b%current) == 0) { // check if current is a factor of b
// if current is a factor of both a and b, then current
// is the GCF and we can break out of the loop
break;
}
}
--current;
}
return current;
}
// or for a slightly more concise version...
public static int GCF(int a, int b) {
for(int current = Math.min(a,b); current > 1; --current) {
if( (a%current)==0 && (b%current==0) ) {
return current;
}
}
return 1;
}
Again, both of these algorithms perform in O(n) time, which can be quite terrible for large numbers and/or slow machines.
Introduction to Database
INTRODUCTION TO DATABASE with MS Access 2003
Databases are used every day, sometimes without us realizing. They are everywhere. The most basic example is a telephone book or a library card index. They can store all sorts of information, from phone numbers to map grids and references, score cards from sports games, report cards, etc. They allow quick searching and are great for keeping historical data, for example weather history. Most websites run using a combination of a database and a CMS (content management system).
At the most basic level, databases contain tables. Database tables are used to hold information, for example you may have a database table about ‘authors’ or ‘news’.
Inside a table, you have fields. Table fields tells us what information is being kept in the database. In an authors table, for example, you may keep the person’s name and email address.
Microsoft Access is a computer application used to create and work with databases. that means it’s a Database Management System or DBMS.
A Microsoft Access database is a single file with the file extension *.mdb and is often referred to as a database application.
A database is basically a collection of data or pieces of information. Whether you know it or not, you use databases all of the time. Some examples of commonly used databases might be:
• Address book
• Library catalogue
• Telephone directory
• Stock list
A database isn’t necessarily contained on a computer. A telephone directory is still a database even if it’s in the form of a huge book sitting next to your phone.
Databases are intended for storing and maintaining large amounts of information. The following are examples of the sort of information that can be kept in a database:
• Inventory control
• Payroll systems
• Personnel records
• Music collection catalogue
• Phone and address lists
Database is a collection of related information or data.
DATA VS. INFORMATION
Data – a collection of facts made up of text, numbers and dates:
Murray 35000 7/18/86
Information - the meaning given to data in the way it is interpreted:
Mr. Murray is a sales person whose annual salary is $35,000 and whose hire date is July 18, 1986.
• Data are facts about people, places, things or events. – unprocessed facts
• Information is a processed data.
BASIC DATABASE CONCEPTS
Table - A set of related records (a set of one or more records)
Record - A collection of data about an individual item
Field - A single item of data common to all records
ACCESS 2003 STRUCTURE
What is Microsoft Access?
• Powerful Relational Database Management System (RDBMS) design to run in Microsoft Windows. Data can be organized as a set of related tables
• Integration with other Office applications allows seamless exchange of data with centralized database
What is an Access Database?
• Collection of data objects stored with filename extension .mdb (Microsoft database)
• Main Access data objects ( Tables, Queries, Forms, Reports, Macros, Modules, Pages)
DATABASE WINDOW
• Main database design/management window
• Displayed when creating or opening an Access database
• You can use the Objects toolbar to access the different objects that make up a database
TABLES
What is table
• Basic container for data, arranged as a grid of rows and columns
• Each row contains a single record
• Each column represents a field within the record
Access tables
• Fundamental data objects in Access
– Forms, queries and reports are all based on tables
• Table Wizard provides automated table creation
• Tables can also be created manually for more precise specification
FORMS
What is form
• Electronic version of paper form
• Used to simplify entry of data into an Access database
QUERIES
What is a Query?
• A question asked of the database
• Used to extract specific information from database
• Used to extract specific information from database
– Example:What is the three top-selling products in our company’s product line?
• Queries are composed of structured query language(SQL) statements
– Example:
SELECT Products.[Product #], Products.[Product Name], Products.Price FROM Products
WHERE (((Products.Price)<4.75));
• Access allows queries to be created graphically
• Hides complexity of SQL language
REPORT
What is report?
– Formatted template used to print reports of database or query results
– Allows user to specify fields, grouping levels, arrangement of printed data
MACROS
What is access macro?
– User-defined sequence of actions to be performed by Access 2000
– Macros will not be covered
MODULES
What is a module?
– User-created sections of code which provide sophisticated automation of Access functions
– Written in Visual Basic for Application(VBA)
CREATING A NEW TABLE IN DESIGN VIEW
For each field in new DATABASE, specify the following items
– FIELD NAME
• Descriptive name of field to be used in table
– 64-character maximum
– Prohibited characters:period(.), accent grave(‘), square brackets([]), exclamation point(!)
– DATA TYPE
• Drop-down list displays available data types
– Number, Date/Time, Currency,Auto number, Yes/No, OLE Object, Hyperlink, Lookup Wizard
– DESCRIPTION
• Comment describing details of field. Appears on the status bar in Datasheet view when you click a row in the field's column
SETTING A PRIMARY KEY
What is a primary key?
– Main index for table
– Must be unique for each record in table
• Example: Product number, Employee number, etc.
– If no such field exist, create a new field with the data type “Autonumber” and specify it as the primary key
• Access will automatically create unique numbers for this field
Assigning a field as the primary key
– Select field
– Click on Primary Key button on toolbar (or use “Edit /Primary Key”)
• A key symbol will appear next to selected field
Thursday, July 22, 2010
Seminar
Seminar Workshop in Research Capability Enhancement for BSCS Students
Little Theater, Notre Dame of Midsayap College
July 31, 2010
Little Theater, Notre Dame of Midsayap College
July 31, 2010
Monday, July 19, 2010
Introduction to Computer
IS/CSE/IT 111 Introduction to Computer
What is Computer?
Computer is a device that performs mathematical and logical operations based on the database with a minimal human interpretation.
It is a device that accepts data, processes and store these, and produces a result/output.
Four Basic Functions
1.Input
2.Process
3.Storage
4.Output
Typically, a computer system consists:
1.Input Devices – which allows the users to input data for processing
2.Storage Devices – where the processed information are stored
3.Central Processing Unit – which interprets and executes data or instruction
4.Output Devices – where outcomes are displayed
Three Main Elements of Computer System
1.HARDWARE – refers to the physical components of a computer that you can actually touch, such as keyboard, monitor, central processing unit, mouse and printer.
HARDWARE may be classified into:
1. Input Devices – these are external devices that provide information and instruction to the computer.
Common Example: Keyboard,Touch tone device, mouse, joystick, touch screen, light pen, scanning device, Fax Machine, phone card, digital cameras, sensor
2. Output Devices – these are devices that will communicate the result of processing back to the user by converting electrical signals from the Arithmetic/Logic Unit. Output devices that will produce result/output.
Common Example: monitors, Printer, Plotter, speakers
3. Central Processing Unit (CPU) – performs arithmetic and logical operations on data taken from the primary storage or on information entered through any input devices.
Five basic component of CPU:
1. Main Storage – also called memory/primary storage where instructions and data are stored while processing is done.
Two types of memory inside the main storage:
Random Access Memory (RAM) uses to store given instructions which can later be changed or erased. When data are loaded from the RAM it means WRITING data, when data are accessed it means READING data.
All information stored in it are lost or erased when the computer power is turned off or interrupted. This kind of memory is volatile.
Read Only Memory (ROM) contains stored instructions that a computer requires to be able to do its basic routine operations. The instructions still hold even when there is power interruption or shut-off. This kind of memory are non-volatile. It has a data built in by the manufacturer.
2. REGISTERS – part of the CPU that function as fast-accessed temporary memory locations. The bits of information taken from the main memory and those that will be placed in the main memory are temporarily held in the registers while computation are being performed.
3. BUSES – are bundles of tiny wires that serve as the communication path between components of the CPU. The Three most important buses are the Address, Data and Control Buses.
4. Arithmetic Logic Unit (ALU) – performs all the arithmetic and logical calculations of the CPU.
5. CONTROL UNIT (CU) – is responsible for directing the flow of instructions and data within the CPU. It fetches the instructions from the main memory for execution in the CPU. Aside from controlling the input and output devices, it also passes data to the ALU for computation.
4. SECONDARY STORAGE – where data are stored permanently.
Common example hard disk, optical disk (compact disk read only memory (CD), digital versatile disk (DVD)
Two Classes of Secondary Storage:
1. Direct Access Media – (floppy disk, flash memory(usb)) supports sequential of random access where data can be accessed directly)
2. Sequential Access Media – where data are accessed in a specific order. (magnetic tape – traditional medium for long term storage but slowest in terms of retrieval of data)
2.SOFTWARE – is untouchable. It is a set of instructions used to direct the hardware on how to turn data into useful information for people to use.
A set of instructions or program that tells the computer how to do a specific task.
Two types of Software:
1.SYSTEM SOFTWARE – refers to computer programs of library files whose purpose is to help run the computer system.
Example – Operating System (manage the whole operation of the computer), output devices (provides interface to the hardware) Utility Programs (who manage files), Compilers and interpreters (programs that will translate high-level language programs into object code)
2.APPLICATION SOFTWARE – performs specific functions, which make daily activities easier and facilitate the performance of work efficiently and effectively.
Categories of Application Software:
1.Productivity Tools – eg. Software like Word Processing, Spreadsheet, Database, Presentation Graphics, Personal Information Manager Software and Project Management.
2.Graphics and Multimedia –eg. Software like Computer-Aided Design, Desktop Publishing, Web Page Design, Image Editing, Video/Audio Editing, Multimedia Authoring
3.Home, Personal and Educational Use – eg. Software like Integrated software, Personal Finance software, Clip Art/Image Gallery, Legal Software, Educational Software, Entertainment Software.
4.Communications – eg. Software like E-mail Software, Web Browser, Chat client Software, Newsreader Software, Instant Messenger software, Groupware software, Videoconference software.
Three basic types of application software:
1.COMMERCIAL – comes prepackage and is available from software vendors. It must be purchased.
2.SHAREWARE – are software develop a d released as demonstration versions of their commercial product. Each demonstration copy has an expiration date which gives the user ample time to evaluate and decide whether the purchase the product or not.
3.OPEN SOURCE – software that is created by generous programmers and released to the public domain for free and for public use.
3.PEOPLEWARE – who use the computer system, they are the most important factor in a computer system because they manipulate and program the computer system to make it useful.
- The skilled workers in the Information Technology field.
The major compositions of IT Professionals:
1.Management Group – eg. Computer System Manager
2.Systems and Procedures Group – Computer Scientist, Computer Engineer, System Analyst
3.Programming Group – Computer Programmer
4.Computer Operations Group - Computer Operator, Data Encoder, Data Entry Operator, Computer Librarian
CAPABILITIES OF COMPUTER
1.Computer can do repetitive and routine work.
2.Computer can process large amount of data.
3.Computers are reliable and accurate.
4.Computer can store and retrieve large amount of information.
5.Computers have a self-checking ability.
6.Computer can be self-operating.
7.Computers can do remote processing.
LIMITATIONS OF COMPUTER
1.Computers are dependent on instruction and data.
2.Computers cannot generate information.
3.Computers cannot correct wrong instructions.
4.Computers cannot decide specific task. (except if they are programmed)
5.Computers are vulnerable to a virus attack.
Assignment: Note Book (Reference: Introduction to Information Technology by Albano-Atole and other computer books or use Internet)
1.Classifications Computers
2.History of Computing (from 2000 B.C. to present)
Monday, June 21, 2010
Introduction to Computer & Productivity Tools
click the link below for your reference, other reference will follow.
CSE 111 - Introduction to Computer
CSE 112 - Productivity Tools
Steve's PC Tutorials
CSE 111 - Introduction to Computer
CSE 112 - Productivity Tools
Steve's PC Tutorials
Tuesday, June 8, 2010
Productivity Tools
100 Terrific Productivity Tools for the Bored or Unemployed CLICK the LINK!!!
From http://www.onlinecollege.org
The College Student's Productivity Guide - 27 Apps, Tools, and Resources CLICK the LINK!!!
From http://oedb.org
100 Free Productivity Tools to Get You Through School
http://www.onlineuniversities.com
From http://www.onlinecollege.org
The College Student's Productivity Guide - 27 Apps, Tools, and Resources CLICK the LINK!!!
From http://oedb.org
100 Free Productivity Tools to Get You Through School
http://www.onlineuniversities.com
Sign Up Notre Damean
Notre Dame of Midsayap College Connecting Students, Alumni, Teachers, and Friends
Sign Up with the link above The First Notre Dame in Asia - Notre Dame of Midsayap College
Sign Up with the link above The First Notre Dame in Asia - Notre Dame of Midsayap College
Tuesday, May 11, 2010
Computerized Election 2010

Thursday, April 29, 2010
Student's Summer Homepage
Montemayor, Christian King V.
Masukat, Samid R.
Almazan, Philip G.
Balacano, Joylyn M.
Alcoran, John Michael S.
Fabia, Romelyn S.
Mana-ay, Charmagne Jane M.
Selibio, Arian P.
Casile, Joje L.
Cagang, James Roi V.
Fuerte, Jethro A.
Ariego, Honeylette G.
Cataluña, Clifferd B.
Omalde, Noelle Fenella A.
Alpas, Melanie P.
Daquiado, Jenelyn O.
Arradaza, Fluerdeliz V.
Pahil, David Garth T.
Millena, Quennie Jane P.
Labiao, Mary Cristine N.
Wednesday, April 28, 2010
Thursday, April 15, 2010
Vote Wisely!!!
Vote Wisely!!! (even you dont know who's the BEST!)

During a campaign the air is full of speeches - and vice versa. ~Author Unknown
Sunday, February 21, 2010
System Analysis and Design (CSE 314/IT 315)
INTRODUCTION TO SYSTEM ANALYSIS AND DESIGN http://www.nos.org/htm/sad1.htm
INTRODUCTION
Systems are created to solve problems. One can think of the systems approach as an organized way of dealing with a problem. In this dynamic world, The subject System Analysis and Design (SAD), mainly deals with the software development activities.
OBJECTIVES
DEFINING A SYSTEM
A collection of components that work together to realize some objective forms a system. Basically there are three major components in every system, namely input, processing and output.
In a system the different components are connected with each other and they are interdependent. For example, human body represents a complete natural system. We are also bound by many national systems such as political system, economic system, educational system and so forth. The objective of the system demand that some output is produced as a result of processing the suitable inputs.
29.4 SYSTEM LIFE CYCLE
System life cycle is an organisational process of developing and maintaining systems. It helps in establishing a system project plan, because it gives overall list of processes and sub-processes required for developing a system.
System development life cycle means combination of various activities. In other words we can say that various activities put together are referred as system development life cycle. In the System Analysis and Design terminology, the system development life cycle means software development life cycle.
Following are the different phases of software development cycle:
PHASES OF SYSTEM DEVELOPMENT LIFE CYCLE
(a) System Study
System study is the first stage of system development life cycle. This gives a clear picture of what actually the physical system is? In practice, the system study is done in two phases. In the first phase, the preliminary survey of the system is done which helps in identifying the scope of the system. The second phase of the system study is more detailed and in-depth study in which the identification of user’s requirement and the limitations and problems of the present system are studied. After completing the system study, a system proposal is prepared by the System Analyst (who studies the system) and placed before the user. The proposed system contains the findings of the present system and recommendations to overcome the limitations and problems of the present system in the light of the user’s requirements.
To describe the system study phase more analytically, we would say that system study phase passes through the following steps:
(b) Feasibility Study
On the basis of result of the system study, feasibility study takes place. The feasibility study is basically the test of the proposed system in the light of its workability, meeting user’s requirements, effective use of resources and .of course, the cost effectiveness. The main goal of feasibility study is not to solve the problem but to achieve the scope. In the process of feasibility study, the cost and benefits are estimated with greater accuracy.
(c) System Analysis
Assuming that a new system is to be developed, the next phase is system analysis. Analysis involved a detailed study of the current system, leading to specifications of a new system. Analysis is a detailed study of various operations performed by a system and their relationships within and outside the system. During analysis, data are collected on the available files, decision points and transactions handled by the present system. Interviews, on-site observation and questionnaire are the tools used for system analysis. Using the following steps it becomes easy to draw the exact boundary of the new system under consideration:
All procedures, requirements must be analysed and documented in the form of detailed data flow diagrams (DFDs), data dictionary, logical data structures and miniature specifications. System Analysis also includes sub-dividing of complex process involving the entire system, identification of data store and manual processes.
The main points to be discussed in system analysis are:
Based on the user requirements and the detailed analysis of a new system, the new system must be designed. This is the phase of system designing. It is the most crucial phase in the development of a system. Normally, the design proceeds in two stages:
Preliminary or general design: In the preliminary or general design, the features of the new system are specified. The costs of implementing these features and the benefits to be derived are estimated. If the project is still considered to be feasible, we move to the detailed design stage.
Structure or Detailed design : In the detailed design stage, computer oriented work begins in earnest. At this stage, the design of the system becomes more structured. Structure design is a blue print of a computer system solution to a given problem having the same components and inter-relationship among the same components as the original problem. Input, output and processing specifications are drawn up in detail. In the design stage, the programming language and the platform in which the new system will run are also decided.
There are several tools and techniques used for designing. These tools and techniques are:
(e) Coding
After designing the new system, the whole system is required to be converted into computer understanding language. Coding the new system into computer programming language does this. It is an important stage where the defined procedures are transformed into control specifications by the help of a computer language. This is also called the programming phase in which the programmer converts the program specifications into computer instructions, which we refer as programs. The programs coordinate the data movements and control the entire process in a system.
It is generally felt that the programs must be modular in nature. This helps in fast development, maintenance and future change, if required.
(f) Testing
Before actually implementing the new system into operations, a test run of the system is done removing all the bugs, if any. It is an important phase of a successful system. After codifying the whole programs of the system, a test plan should be developed and run on a given set of test data. The output of the test run should match the expected results.
Using the test data following test run are carried out:
Unit test : When the programs have been coded and compiled and brought to working conditions, they must be individually tested with the prepared test data. Any undesirable happening must be noted and debugged (error corrections).
System Test : After carrying out the unit test for each of the programs of the system and when errors are removed, then system test is done. At this stage the test is done on actual data. The complete system is executed on the actual data. At each stage of the execution, the results or output of the system is analysed. During the result analysis, it may be found that the outputs are not matching the expected out of the system. In such case, the errors in the particular programs are identified and are fixed and further tested for the expected output.
When it is ensured that the system is running error-free, the users are called with their own actual data so that the system could be shown running as per their requirements.
(g) Implementation
After having the user acceptance of the new system developed, the implementation phase begins. Implementation is the stage of a project during which theory is turned into practice. During this phase, all the programs of the system are loaded onto the user’s computer. After loading the system, training of the user starts. Main topics of such type of training are:
(i) Parallel run : In such run for a certain defined period, both the systems, i.e., computerised and manual, are executed in parallel. This strategy is helpful because of the following:
(h) Maintenance
Maintenance is necessary to eliminate errors in the system during its working life and to tune the system to any variations in its working environment. It has been seen that there are always some errors found in the system that must be noted and corrected. It also means the review of the system from time to time. The review of the system is done for:
INTRODUCTION
Systems are created to solve problems. One can think of the systems approach as an organized way of dealing with a problem. In this dynamic world, The subject System Analysis and Design (SAD), mainly deals with the software development activities.
OBJECTIVES
- After going through this lesson, you should be able to:
- understand a system
- understand the different phases of system developments life cycle
- know the components of system analysis
- know the components of system designing
DEFINING A SYSTEM
A collection of components that work together to realize some objective forms a system. Basically there are three major components in every system, namely input, processing and output.
In a system the different components are connected with each other and they are interdependent. For example, human body represents a complete natural system. We are also bound by many national systems such as political system, economic system, educational system and so forth. The objective of the system demand that some output is produced as a result of processing the suitable inputs.
29.4 SYSTEM LIFE CYCLE
System life cycle is an organisational process of developing and maintaining systems. It helps in establishing a system project plan, because it gives overall list of processes and sub-processes required for developing a system.
System development life cycle means combination of various activities. In other words we can say that various activities put together are referred as system development life cycle. In the System Analysis and Design terminology, the system development life cycle means software development life cycle.
Following are the different phases of software development cycle:
- System study
- Feasibility study
- System analysis
- System design
- Coding
- Testing
- Implementation
- Maintenance
PHASES OF SYSTEM DEVELOPMENT LIFE CYCLE
(a) System Study
System study is the first stage of system development life cycle. This gives a clear picture of what actually the physical system is? In practice, the system study is done in two phases. In the first phase, the preliminary survey of the system is done which helps in identifying the scope of the system. The second phase of the system study is more detailed and in-depth study in which the identification of user’s requirement and the limitations and problems of the present system are studied. After completing the system study, a system proposal is prepared by the System Analyst (who studies the system) and placed before the user. The proposed system contains the findings of the present system and recommendations to overcome the limitations and problems of the present system in the light of the user’s requirements.
To describe the system study phase more analytically, we would say that system study phase passes through the following steps:
- problem identification and project initiation
- background analysis
- inference or findings
(b) Feasibility Study
On the basis of result of the system study, feasibility study takes place. The feasibility study is basically the test of the proposed system in the light of its workability, meeting user’s requirements, effective use of resources and .of course, the cost effectiveness. The main goal of feasibility study is not to solve the problem but to achieve the scope. In the process of feasibility study, the cost and benefits are estimated with greater accuracy.
(c) System Analysis
Assuming that a new system is to be developed, the next phase is system analysis. Analysis involved a detailed study of the current system, leading to specifications of a new system. Analysis is a detailed study of various operations performed by a system and their relationships within and outside the system. During analysis, data are collected on the available files, decision points and transactions handled by the present system. Interviews, on-site observation and questionnaire are the tools used for system analysis. Using the following steps it becomes easy to draw the exact boundary of the new system under consideration:
- Keeping in view the problems and new requirements
- Workout the pros and cons including new areas of the system
All procedures, requirements must be analysed and documented in the form of detailed data flow diagrams (DFDs), data dictionary, logical data structures and miniature specifications. System Analysis also includes sub-dividing of complex process involving the entire system, identification of data store and manual processes.
The main points to be discussed in system analysis are:
- Specification of what the new system is to accomplish based on the user requirements.
- Functional hierarchy showing the functions to be performed by the new system and their relationship with each other.
- Function network, which are similar to function hierarchy but they highlight the functions which are common to more than one procedure.
- List of attributes of the entities - these are the data items which need to be held about each entity (record)
Based on the user requirements and the detailed analysis of a new system, the new system must be designed. This is the phase of system designing. It is the most crucial phase in the development of a system. Normally, the design proceeds in two stages:
- Preliminary or general design
- Structure or detailed design
Preliminary or general design: In the preliminary or general design, the features of the new system are specified. The costs of implementing these features and the benefits to be derived are estimated. If the project is still considered to be feasible, we move to the detailed design stage.
Structure or Detailed design : In the detailed design stage, computer oriented work begins in earnest. At this stage, the design of the system becomes more structured. Structure design is a blue print of a computer system solution to a given problem having the same components and inter-relationship among the same components as the original problem. Input, output and processing specifications are drawn up in detail. In the design stage, the programming language and the platform in which the new system will run are also decided.
There are several tools and techniques used for designing. These tools and techniques are:
- Flowchart
- Data flow diagram (DFDs)
- Data dictionary
- Structured English
- Decision table
- Decision tree
(e) Coding
After designing the new system, the whole system is required to be converted into computer understanding language. Coding the new system into computer programming language does this. It is an important stage where the defined procedures are transformed into control specifications by the help of a computer language. This is also called the programming phase in which the programmer converts the program specifications into computer instructions, which we refer as programs. The programs coordinate the data movements and control the entire process in a system.
It is generally felt that the programs must be modular in nature. This helps in fast development, maintenance and future change, if required.
(f) Testing
Before actually implementing the new system into operations, a test run of the system is done removing all the bugs, if any. It is an important phase of a successful system. After codifying the whole programs of the system, a test plan should be developed and run on a given set of test data. The output of the test run should match the expected results.
Using the test data following test run are carried out:
- Unit test
- System test
Unit test : When the programs have been coded and compiled and brought to working conditions, they must be individually tested with the prepared test data. Any undesirable happening must be noted and debugged (error corrections).
System Test : After carrying out the unit test for each of the programs of the system and when errors are removed, then system test is done. At this stage the test is done on actual data. The complete system is executed on the actual data. At each stage of the execution, the results or output of the system is analysed. During the result analysis, it may be found that the outputs are not matching the expected out of the system. In such case, the errors in the particular programs are identified and are fixed and further tested for the expected output.
When it is ensured that the system is running error-free, the users are called with their own actual data so that the system could be shown running as per their requirements.
(g) Implementation
After having the user acceptance of the new system developed, the implementation phase begins. Implementation is the stage of a project during which theory is turned into practice. During this phase, all the programs of the system are loaded onto the user’s computer. After loading the system, training of the user starts. Main topics of such type of training are:
- How to execute the package
- How to enter the data
- How to process the data (processing details)
- How to take out the reports
(i) Parallel run : In such run for a certain defined period, both the systems, i.e., computerised and manual, are executed in parallel. This strategy is helpful because of the following:
- Manual results can be compared with the results of the computerised system.
- Failure of the computerised system at the early stage does not affect the working of the organisation, because the manual system continues to work, as it used to do.
(h) Maintenance
Maintenance is necessary to eliminate errors in the system during its working life and to tune the system to any variations in its working environment. It has been seen that there are always some errors found in the system that must be noted and corrected. It also means the review of the system from time to time. The review of the system is done for:
- knowing the full capabilities of the system
- knowing the required changes or the additional requirements
- studying the performance
Thursday, January 14, 2010
Seminar
Phillippine Society of Information Technology Educators Foundation, Inc.
Region XII Chapter
IT Reseach and Digital Image Analysis Seminar
January 14-16, 2010, Notre Dame of Kidapawan College
Vladimir Y. Mariano, Ph. D.
Institute of Computer Science
University of the Philippines
Los Baños
Email: vymariano@uplb.edu.ph
Research Areas: Digital Image Processing, Computer Vision, Pattern Recognition
Friday, January 8, 2010
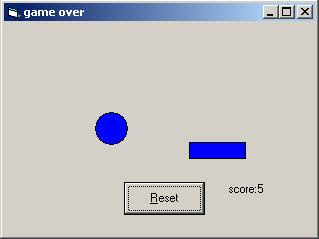
CSE 122 / IT 122 Study and Debug the vb game program (MIDTERM)
These are the objects: 2 shapes(circle and rectangle), 1 timer(interval=500), 1 label (caption=Score:), 1 command button (caption=&Reset)
Note: Use a prefixes in naming of each objects/controls.
controls that has a code: form_load, form_mousemove,timer,command button
Dim v As Integer, Y As Integer, score As Integer
Private Sub Form_Load()
ball.Left = 2500
ball.Top = 1300
X = -50
Y = -50
End Sub
Private Sub Form_MouseMove(Button As Integer, Shift As Integer, X As Single, Y As Single)
pad.Left = X - pad.Width / 2
End Sub
Private Sub reset_Click()
ball.Left = 2500
ball.Top = 1300
X = -50
Y = -50
reset..Visible = False
score = 0 ' reset the score
scorecard.Caption = "score:" & score ' show the score on our label
Me.Caption = "score:" & score
Timer1.Enabled = True ' start the timer again to get the ball moving
End Sub
Private Sub Time1_Timer()
ball.Move ball.Left + X, ball.Top + Y
If balll.Top <= 0 Then Y = Y * -1 End If If ball.Left <= 0 Then X = X * -1 End If If ball.Left + ball.Width >= Me.ScaleWidth Then
X = X * -1
End If
If ball.Top + ball.Height >= pad.Top Then
If (ball.Left + ball.Width < pad.Left) Or (ball.Left > pad.Left + pad.Width) Then
'if the ball is to the left or right of the pad then
Me.Caption = "game over" ' set the forms captions to read game over
reset.Visible = True 'make the reset button visible
Timer.Enabled = False ' pause the program
Else
Y = Y * -1.05 'speed up the ball
X = X * 1.05 '
score = score + 1 'add 1 more hit to the score
scorecard.Caption = "score:" & score 'show the score on our label
Me.Caption = "score:" & score ' show the score as our forms caption
If (ball.Left + ball.Width / 2) < (pad.Left + pad.Width / 2) Then 'if the ball is to the left or the pad center then If X > 0 Then ' if it is going to the right
X = X * -1 'make it go left
End If
Else ' the ball must be on the right of the pad
If X < 0 Then 'if it is going left
X = X * -1 'make it go right
End If
End If
End If
End If
endif
End Sub
Design View

Output View

Wednesday, January 6, 2010


Subscribe to:
Posts (Atom)